
Network View
General Visualizations in Network View
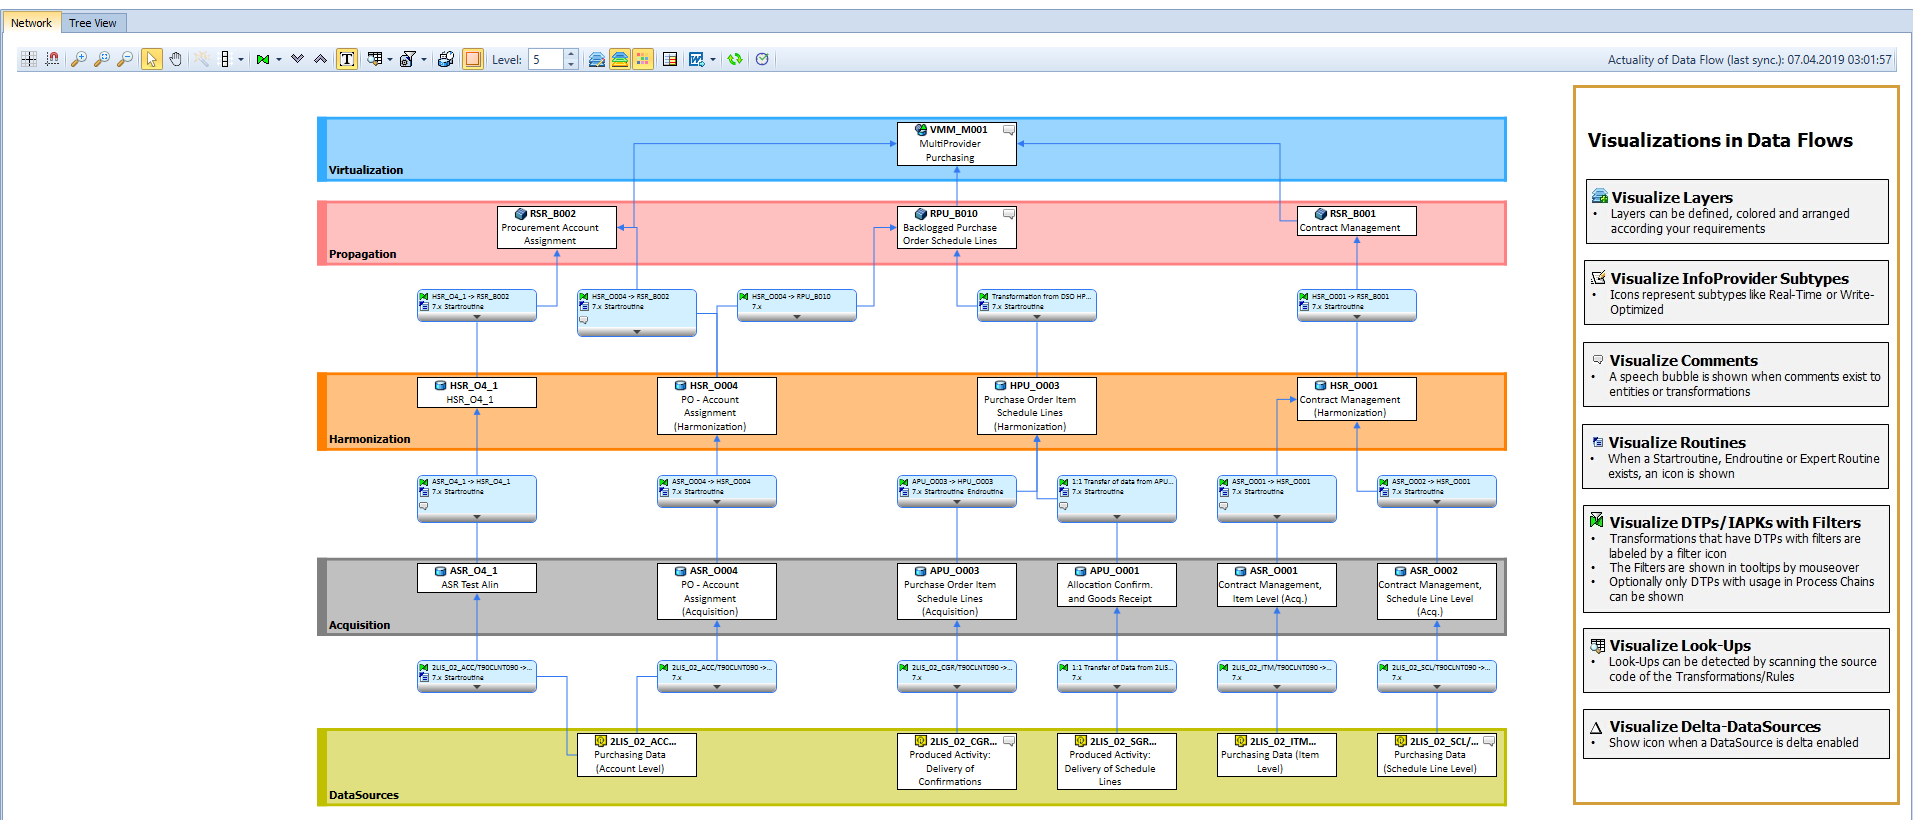
Data Flows can be shown as a tree view and as a network. You can easily switch between the different layouts with the tabs "Tree View" and "Network". The standard layout of Data Flows can be enhanced by additional information. For some of them (DTP+InfoPackage Filter, Look-Ups) the System Scout is required. Also, comments can only be shown in case the Docu Performer is licensed.
Nodes
Entity nodes
Entity nodes in the Data Flow are shown with the icon of the related entity type and the technical name in the first row. For HANA entities you can see the Package or Path in the second row (written italic). For ABAP CDS entities in the second row (written italic) you can see the DDIC View name. For HANA and ABAP CDS entities, the third row shows the description of the entities. BW and DDIC nodes have their description in the second row.
If an entity is not synchronized you can see this in the icon in the node (for more details see Unsynchronized Entities).
Transformation nodes
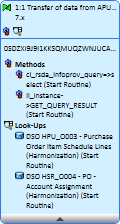
In the nodes of transformations, you can find some more details after you started one of the analysis functions (see Data Flow Analysis).
Toolbar Items
In the following, the toolbar and the functionalities are explained:

It is possible to show/hide a grid in the background of the Data Flow 

You can zoom in 

Furthermore, you can reset the zoom to the default setting 
The function of your cursor can be changed from the standard pointer 

The Layout of the Data Flow can be optimized 

You can change the display of Transformations from nods to small icons ![]()


This especially makes sense after you started a Data Flow Analysis before.
You can show and hide the description of the nodes ![]()
The System Scout functionalities Look-Up Analysis 


You can access the Data Flow Layer maintenance 


With 