Visualization of Data Flows
This article describes how to start the Data Flows in the Performer Suite and which functionalities are available there.
Start Data Flows
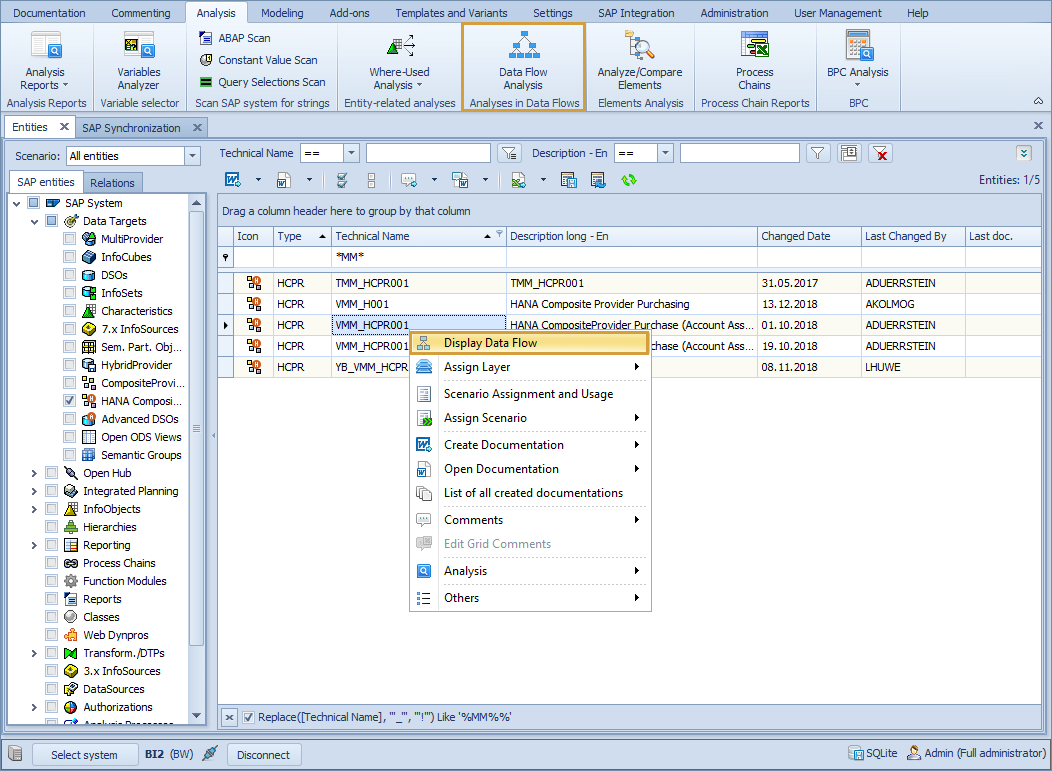
There are two ways to start the Data Flow function in the Performer Suite (see screenshot). One is from the context menu entry "Display Data Flow" in the Entity Grid, another is from the ribbon "Data Flow Analysis" in the System Scout area.

The context menu entry opens the Data Flow of the selected entity directly. The ribbon "Data Flow Analysis" opens an area where you can select all supported entities of the chosen BW system. The ribbon "Data Flow Analysis" is currently not supported for HANA.
Display Options
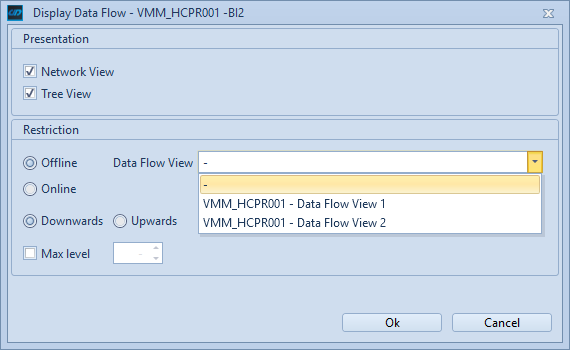
In both cases when you click on the entry in the context menu or when you start the Data Flow visualization from the Data Flow Analysis area a popup appears where you can insert some properties related to the presentation and restriction of the Data Flow.

Presentation
The Network View option opens a tab in the Data Flow display section which shows the Data Flow as a graph.

The Tree View option opens a tab in the Data Flow display section which shows the Data Flow as a tree structure.

Both presentations have their advantages and different functionalities.
Restriction
If Offline is selected, you could choose the default offline Data Flow (represented by "-") or select a Data Flow View.
Offline Data Flow
For BW entities a default offline Data Flow is stored during the synchronization. For Data Flows of HANA, CDS and DDIC entities no default offline Data Flow is stored.
If Online is selected, the Data Flow would be build-up live from the SAP system in the display section of the Data Flows.
If Downwards is selected, the downward Data Flow of the chosen entity would be displayed in the display section of Data Flows.
If Upwards is selected, the upward Data Flow of the chosen entity would be displayed in the display section of Data Flows.
With Max Level, you are able to restrict the levels of the displayed Data Flow.
