
Analyze and Compare BW Entities
With the function Analyze/Compare the structure of SAP objects can be analysed and then compared across systems.
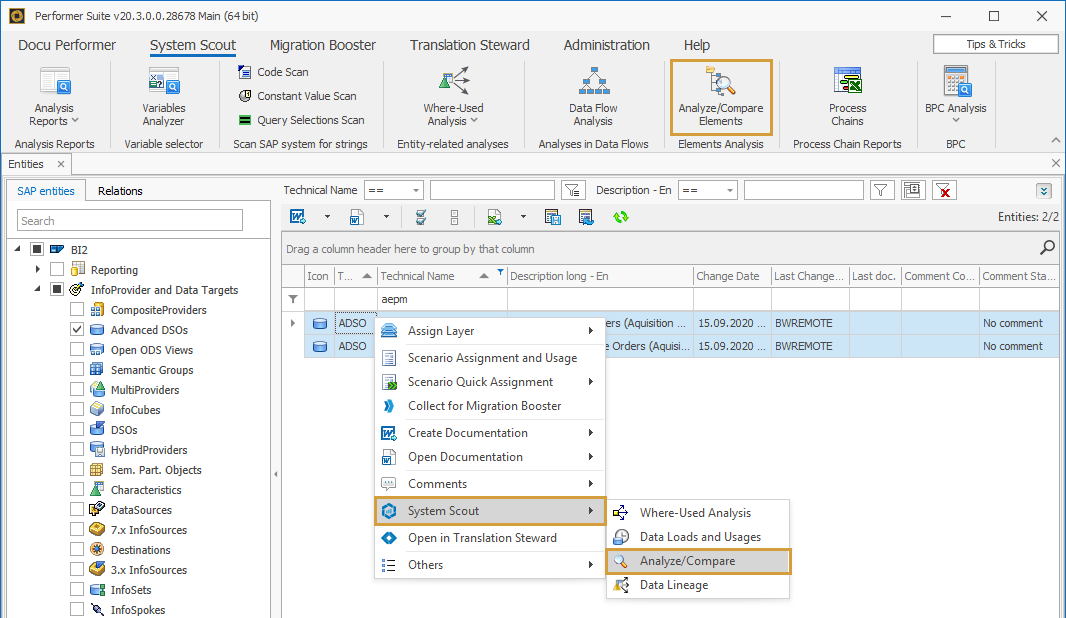
The function can either be started from the Entity Grid via the context menu of the respective object or via the button "Analyze/Compare" in the System Scout ribbon:
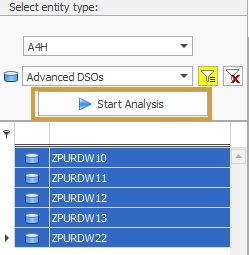
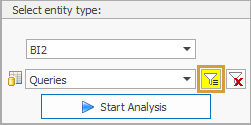
If the function was started via the System Scout ribbon, the following selections must first be made:
SID
Object type
Objects
The function can be started either for one object or several objects via the button "Start Analysis":
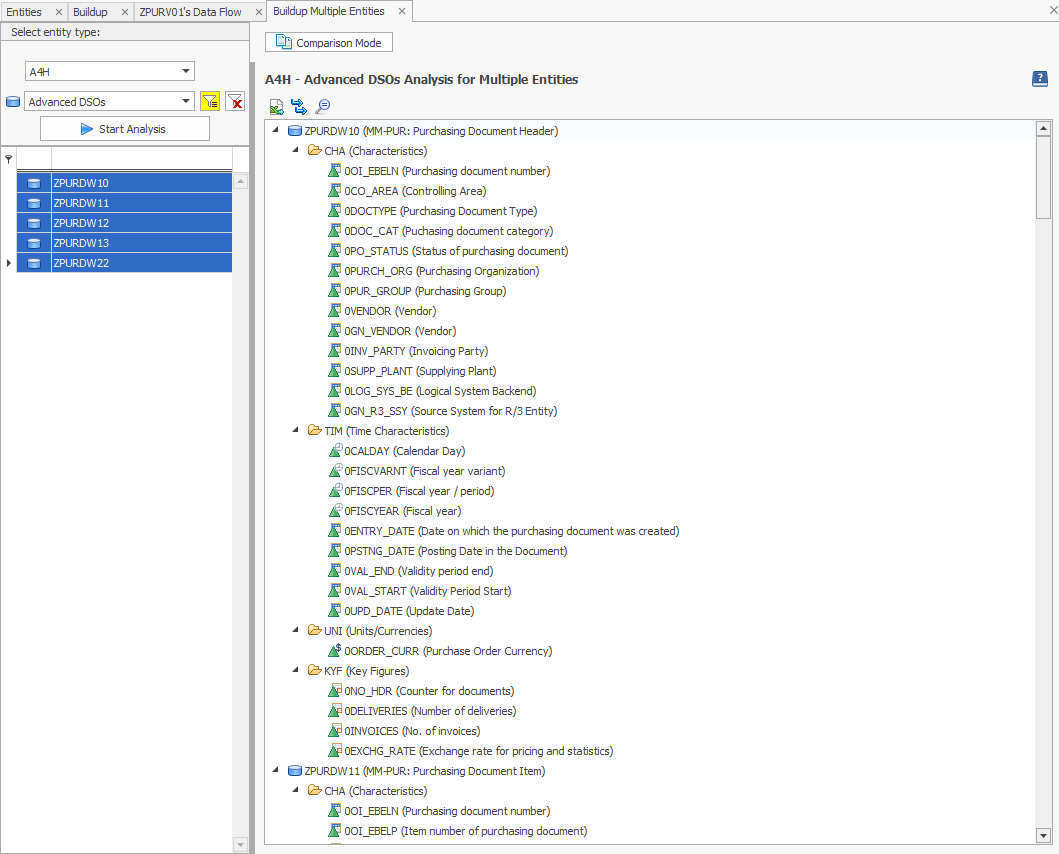
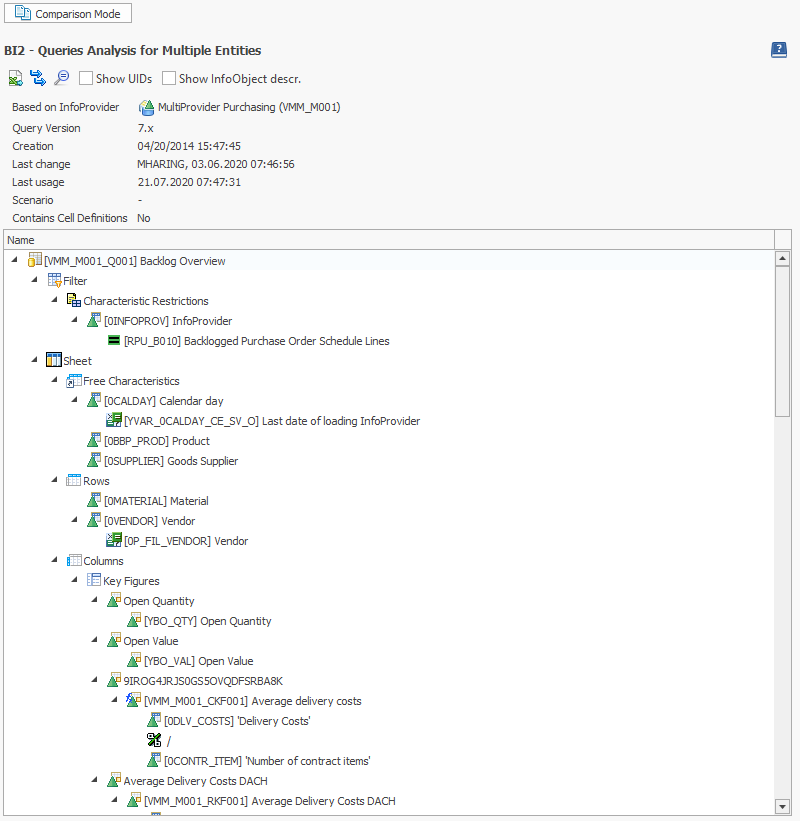
As a result, the System Scout provides the buildup of the analyzed object which makes it easier to understand the structure of SAP objects:
The following functions are available to perform further functions & analyses from this view:
The analyzed buildup of an object can be exported to excel via the Excel Export button
The elements of an analyzed object can be fully expanded with the button Expand all button
All elements of the buildup can be searched for a specific keyword with Search button
Many elements of the objects can be commented or further analyzed via the context menu!
The following object types are supported by this function:
Reporting
Queries
Calculated Key Figures
Restricted Key Figures
Structures
AO Workbooks
Design Studio Reports
InfoProvider and Data Targets
CompositeProviders
Advanced DSOs
Open ODS Views
Semantic Groups
MultiProvider
InfoCubes
DSOs
HybridProvider
Sem. Part. Objects
Characteristics (InfoProvider)
DataSources
7. x InfoSources
Destinations
InfoObjects and Hierarchies
Characteristics
Key Figures
Transformation and DTPs
Transformations 7.x
Data Transfer Processes
Integrated Planning and BPC
Models
Dimensions
Business Process Flows
Scripts Logics
ABAP Entities
Data Definitions
Classes
Function Modules
Reports
Tables/Views
Security
Roles
Others
Process Chains
Transports
Analyzing multiple Entities
It is also possible to display and compare the structure of multiple entities. To do this, you just have to select multiple entities of the same type and start the function as usual. This is possible in the function itself, via the Entity Grid and also via the Compare Entities of Systems function.
To do this, you just have to select multiple entities of the same type and start the function as usual. This is possible in the function itself, via the Entity Grid and also via the Compare Entities of Systems function. To simplify the selection of multiple entities, a multiline filter has been integrated into the Analyze/Compare Elements function.
All the functions explained above are also available for the analysis of multiple entities.
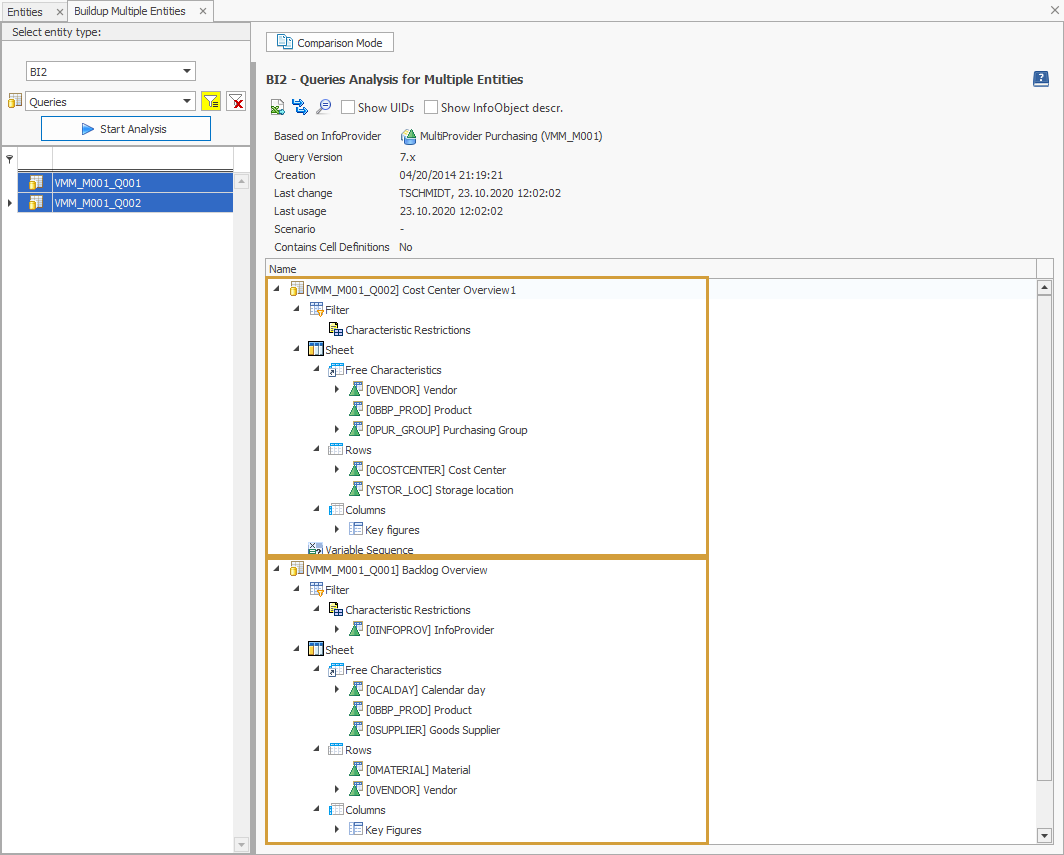
Analyzing Queries
Especially the Queries can be analyzed intensively with this function. The following elements are listed:
Filter
Structures
Variables
Columns, Rows & Free Characteristics
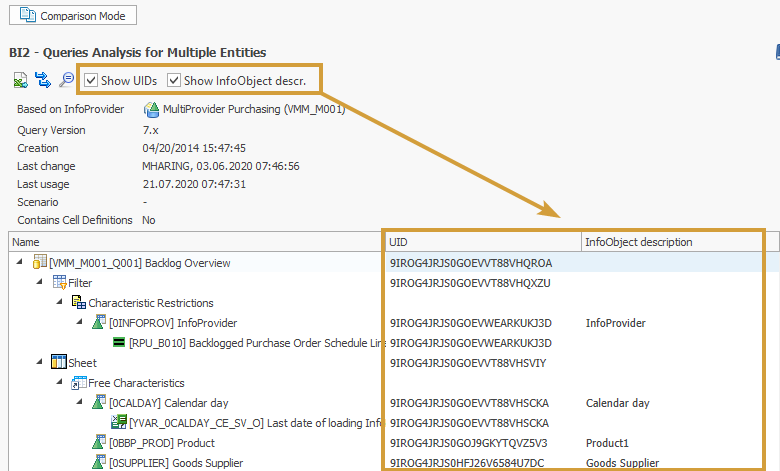
It is possible to add the following information to the structure:
When a query is analyzed, the text variable is also displayed. These text variables can also be commented.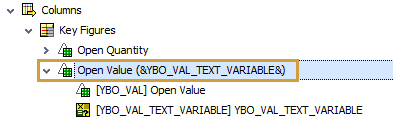
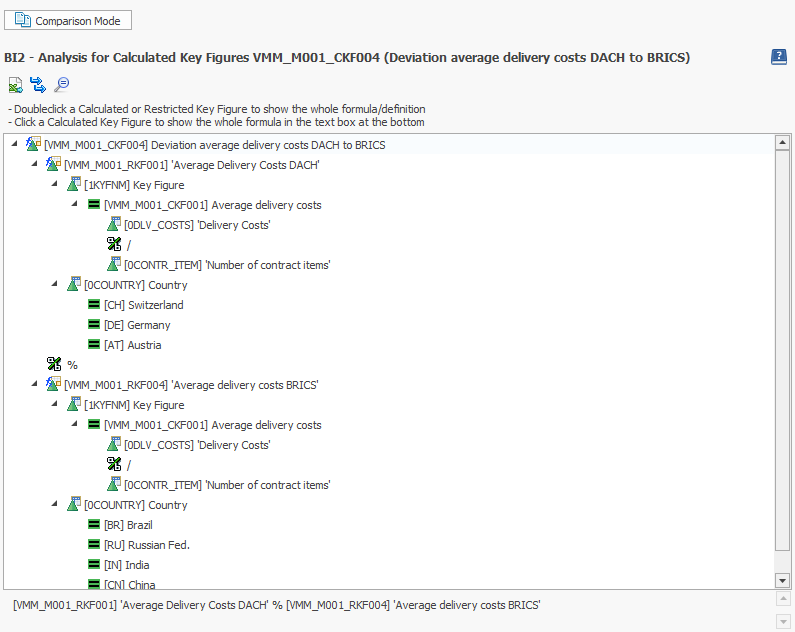
Analyzing Calculated Key Figures
Calculated Key Figures can be deeply nested. To analyze the dependencies in detail the SAP standard offers few resources. In the System Scout, all the components of the formula can be visualized on several levels at a glance. First, the formula of the Calculated Key Figure is displayed in a tree structure, individual elements can be analyzed in detail by double click (resolution of the formula in case of Calculated Key Figures, selection details in case of Restricted Key Figures).
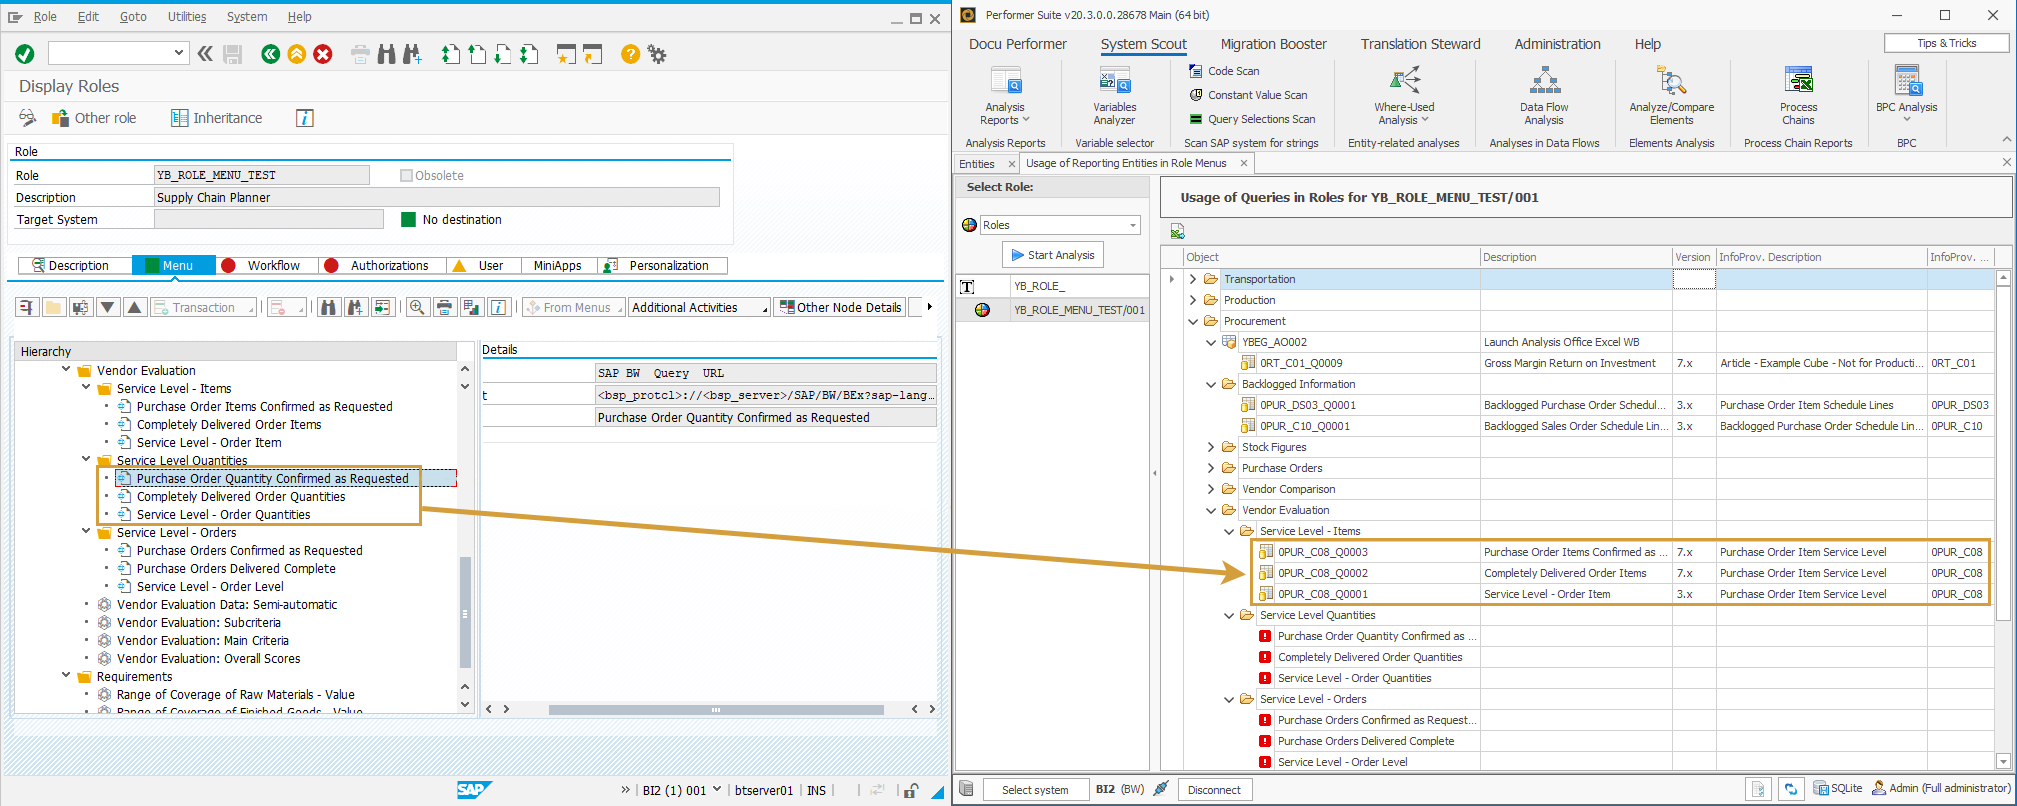
Analyzing Roles
This analysis reads the menu of a selected role, lists the structure (folders) of the role and shows assigned reporting entities of type:
Queries
Query Views
Workbooks
Web Templates
Once a Role has been selected, the function can be started.
System Scout displays all nodes of the role menus and also the objects of the nodes and the InfoProvider on which the objects are based.
Nodes that are not reporting elements are represented by the 